The U.S. Foreclosure Map You Need To See
Foreclosure headlines are making noise again – and they’re designed to stir up fear to get you to read them. But what the data shows is actually happening in the market tells a very different story than what you might be led to believe. So, before you jump to conclusions, it’s important to look at the full picture.
Yes, foreclosure starts are up 7% in the first six months of the year. But zooming out shows that’s nowhere near crisis levels. Here’s why.
Filings Are Still Far Below Crash Levels
Even with the recent uptick, overall foreclosure filings are still very low. In the first half of 2025, just 0.13% of homes had filed for foreclosure. That’s less than 1% of homes in this country. In fact, it’s even far less than that at under a quarter of a percent. That’s a very small fraction of all the homes out there. But like with anything else in real estate, the numbers vary by market.
Here’s the map you need to see that shows how foreclosure rates are lower than you might think, and how they differ by local area:
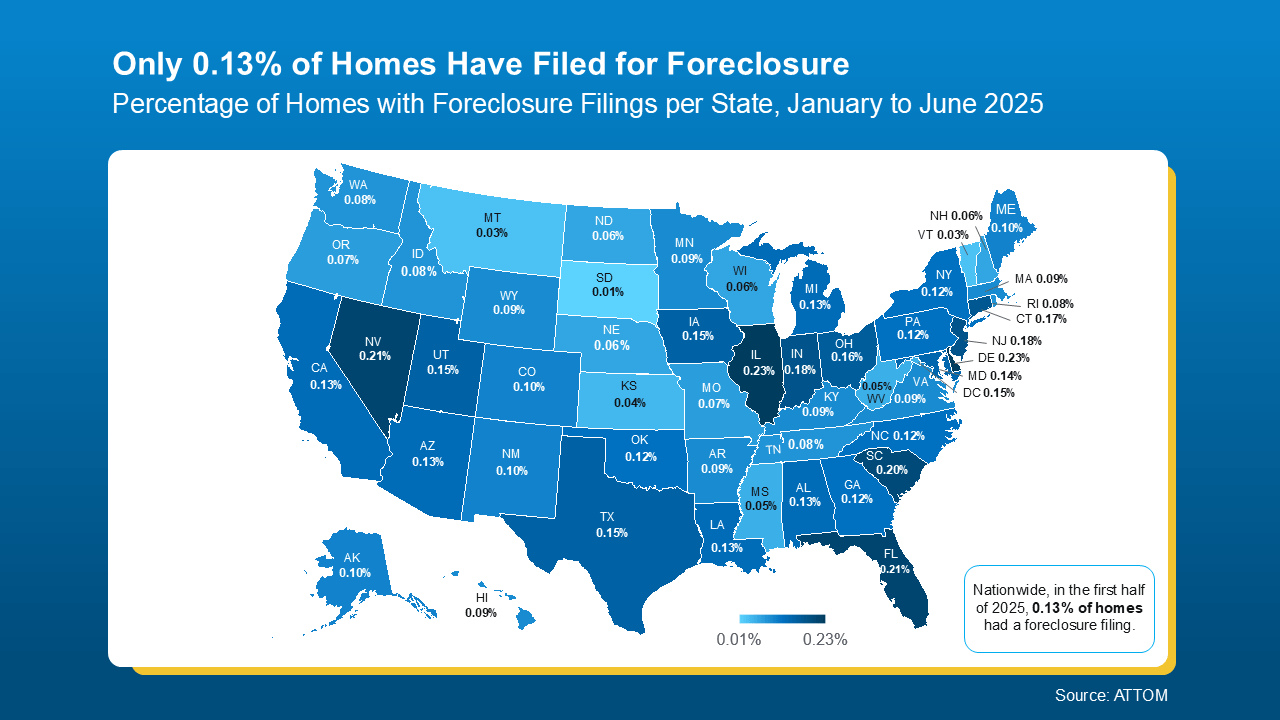 For context, data from ATTOM shows in the first half of 2025, 1 in every 758 homes nationwide had a foreclosure filing. Thats the 0.13% you can see in the map above. But in 2010, back during the crash? Mortgage News Daily says it was 1 in every 45 homes.
Today’s Numbers Don’t Indicate a Market in Trouble
But here’s what everyone remembers…
Leading up to the crash, risky lending practices left homeowners with payments they eventually couldn’t afford. That led to a situation where many homeowners were underwater on their mortgages. When they couldn’t make their payments, they had no choice but to walk away. Foreclosures surged, and the market ultimately crashed.
Today’s housing market is very different. Lending standards are stronger. Homeowners have near record levels of equity. And when someone hits financial trouble, that equity means many people can sell their home rather than face foreclosure. As Rick Sharga, Founder of CJ Patrick Company, explains:
“. . . a significant factor contributing to today’s comparatively low levels of foreclosure activity is that homeowners—including those in foreclosure—possess an unprecedented amount of home equity.”
No one wants to see a homeowner struggle. But if you’re a homeowner facing hardship, talk to your mortgage provider. You may have more options than you think.
Recent headlines may not tell the whole story, but the data does. Foreclosure activity remains low by historical standards and is not a sign of another crash.
If you’re simply watching the market and want to understand what’s really going on, or how this impacts the value of your home, let’s connect. I’ll help you separate fact from fear by showing you what the data really says.
More About:
The U.S. Foreclosure Map You Need To See
Introduction: A Nation Watching the Numbers
Lurking beneath the hum of the U.S. housing market, a familiar buzz has returned: foreclosure headlines. Flashy. Fear-inducing. Popping up like weeds across news feeds and inboxes. They whisper of trouble and hint at collapse. But if you’re looking for the truth behind the turmoil, it’s time to lift the veil and observe what’s actually unfolding. Spoiler alert: it’s not another mortgage crisis.
While some claim the market is inching toward crisis levels, the data tells a different tale—one of resilience, not ruin. The much-hyped surge in foreclosure activity? A statistical ripple, not a tsunami.
Let’s zoom out and explore the U.S. Foreclosure Map, dig into real trends, decode the percentages, and see why this isn’t a sequel to the 2010 foreclosure crisis—and most importantly, what it means for homeowners across the country, from West Palm Beach to the Pacific coast.
Section 1: Behind the Headlines – The Power of Perspective
Let’s begin with what the headlines don’t scream loud enough—context.
Yes, foreclosure starts have ticked up slightly. But consider this: in the first half of 2025, the national foreclosure rate hovered around 0.13% foreclosure rate. That translates to just 1 in every 758 homes filing for foreclosure, according to ATTOM data.
Compare that to the 2010 foreclosure crisis, when a staggering 1 in every 45 homes faced the same fate. That era, marred by risky lending practices and evaporating equity, decimated communities. That was a market drenched in fear and financial instability. Today’s climate? Entirely different.
Here’s what matters: today’s housing market is operating under tighter lending standards. Lenders aren’t throwing caution to the wind. And that makes a monumental difference.
Section 2: Comparing Past and Present — The Value of Zooming Out
Zooming out means resisting the urge to panic at isolated metrics. It’s not enough to hear “foreclosure filings are up 7%.” What matters is how those numbers sit within a broader historical framework.
That’s where the U.S. Foreclosure Map becomes an invaluable tool.
Look at the big picture, and you’ll see: foreclosure rates are not universal. They vary dramatically across local housing markets. Coastal cities, inland suburbs, booming metros, and sleepy rural towns all tell different stories.
For example, West Palm Beach—a city with vibrant growth and surging demand—shows a foreclosure pattern far less severe than national fears might suggest. With support from a West Palm Beach mortgage broker or access to Affordable West Palm Beach home loans, residents are finding more ways to manage than to default.
That’s no accident. Stronger equity positions and informed decision-making are changing the game.
Section 3: Equity – The Unsung Hero of 2025
At the heart of today’s real estate market stability is one critical factor: equity.
Unlike the days leading up to the housing crash, homeowners in 2025 are sitting on a mountain of value—an unprecedented amount of home equity that’s giving them options, leverage, and breathing room.
Even those facing hardship are in a different position than they were fifteen years ago. Back in 2010, millions had underwater mortgages, owing more than their homes were worth. They were trapped—cornered by declining values and ballooning payments. The result? A wave of walkaways that fueled the mortgage crisis.
Today, the narrative is rewritten.
Most homeowners now hold a safety net. When financial hardship strikes, they’re far more likely to sell than surrender. That equity, accumulated through appreciation and responsible borrowing, is a bulwark against foreclosure.
As Rick Sharga, founder of CJ Patrick Company, put it:
“A significant factor contributing to today’s comparatively low levels of foreclosure activity is that homeowners—including those in foreclosure—possess an unprecedented amount of home equity.”
That single truth explains so much about why this market isn’t collapsing—it’s adapting.
Section 4: Real Market Drivers in Today’s Housing Landscape
So what’s really behind the modest rise in foreclosure starts?
Certainly not collapsing demand or predatory loans.
Today’s uptick is largely a correction. A return to normal rhythms after years of pandemic-era protections, forbearance programs, and record-low interest rates. Those safety nets delayed many inevitable defaults. Now, as those protections phase out, we’re seeing deferred filings come to the surface—not a surge in new distress.
And importantly, those filings are still a tiny percentage of homes in this country. With just a 0.13% foreclosure rate, the idea that we’re on the edge of a market in trouble doesn’t hold water.
Additionally, the rise of digital platforms and awareness campaigns means more distressed homeowners are seeking help early. Many are reaching out to their mortgage provider to restructure loans, refinance, or explore options before a notice of default ever arrives.
Resources like Mortgage preapproval in West Palm Beach, Property loan advice in West Palm Beach, and tools such as West Palm Beach mortgage calculators are helping borrowers make smarter, faster choices.
Even in markets with elevated filings, such as parts of the Midwest or Rust Belt cities, the picture is complex. It’s not about crash levels, but economic shifts, job volatility, and localized affordability pressures.
To compare data across these regions is to understand one vital truth: the U.S. housing market is not monolithic—it’s a patchwork.
Section 5: West Palm Beach – A Microcosm of Stability
Nestled on Florida’s glittering Atlantic coast, West Palm Beach offers a compelling lens into modern market dynamics.
Despite broader national noise, the city has managed to maintain a relatively low foreclosure rate. How? A cocktail of factors:
-
Rising property values
-
Strong in-migration
-
A vibrant economy
-
Local support from trusted professionals
Access to First time home buyer loans in West Palm Beach and Affordable West Palm Beach home loans has made the dream of homeownership more attainable. For those already owning, West Palm Beach refinancing options and partnerships with local mortgage lenders in West Palm Beach are keeping them in their homes—even through tight financial spots.
Additionally, the influence of a West Palm Beach mortgage broker—someone who can break down the fine print, structure custom lending packages, and advocate for their clients—can’t be understated. These professionals play a pivotal role in reducing foreclosure activity before it begins.
And let’s not forget the importance of the commercial sector. With demand for mixed-use spaces and multi-family investments surging, the guidance of a commercial mortgage broker in West Palm Beach is proving essential to keeping commercial defaults at bay.
Here, we don’t see signs of a market in trouble. We see adaptability.
Section 6: Avoiding Panic and Embracing Data
The fear-driven narrative fed by market headlines can be hard to resist. Bold red letters declaring an increase in foreclosure filings, charts angled sharply upward, ominous terms like “market in trouble” or “housing crash” — they’re engineered for clicks, not clarity.
But clarity comes from numbers. And the numbers still paint a portrait of strength.
Let’s revisit: the national foreclosure rate sits at 0.13% — that’s 1 in every 758 homes. Even in local hotspots, we are nowhere near the 1 in every 45 homes experienced during the 2010 foreclosure crisis.
Those were true crisis levels, driven by unregulated risky lending practices and speculative overbuilding. Today, lending standards are strict. Verification is thorough. Loan terms are rational.
More importantly, homeowners are far more informed. Whether through financial education or digital tools like West Palm Beach mortgage calculators, they’re entering the real estate process with sharper vision and a plan.
The public must stop mistaking post-pandemic normalization for collapse. Real estate isn’t failing; it’s adjusting. And this recalibration is healthy.
Section 7: Mortgage Guidance and Local Lending Support
In times of economic uncertainty, access to local expertise becomes critical. That’s where professionals on the ground, especially in vibrant regions like South Florida, play a pivotal role.
A West Palm Beach mortgage broker is more than just a number cruncher — they’re a guide, an advocate, and a strategist. They help borrowers understand interest rate trends, lending thresholds, and most importantly, their own buying power.
For those buying their first property, resources like First time home buyer loans in West Palm Beach offer not just financing but a foothold into stable ownership. Meanwhile, those looking to restructure or reduce payments can explore West Palm Beach refinancing options, often avoiding the spiral that leads to default.
Commercial ventures also benefit from expert input. With mixed-use developments booming in areas like Palm Beach County, having a commercial mortgage broker in West Palm Beach who understands the terrain can be the difference between thriving and defaulting.
Additionally, personalized property loan advice in West Palm Beach helps bridge the gap between ambition and prudence. Instead of reacting to fear, borrowers are empowered to navigate change smartly.
And when issues arise? The first move is not panic—it’s communication. It’s time to talk to your mortgage provider. Whether you’re navigating short-term difficulty or seeking long-term relief, collaboration often beats foreclosure.
Section 8: Real Estate Resilience and What Lies Ahead
Resilience is the word that best defines today’s housing market.
Even with rising interest rates, global economic uncertainty, and shifting work patterns, the U.S. real estate market has stood its ground. In many cities, including West Palm Beach, home value continues to appreciate, albeit more slowly. Inventory remains tight, and demand is steady.
Why?
Because unlike the years preceding the mortgage crisis, we’re not overbuilt or over-leveraged. We’re measured.
And the vast majority of homeowners are holding onto strong equity positions — an amount of home equity that provides them not just confidence, but a financial cushion.
When they face hardship, they have the means to avoid foreclosure. They can sell, restructure, or refinance. And many do—long before their home is at risk.
Even those who end up in the foreclosure map are rarely underwater. The days of owing 120% of your home’s value are behind us. Thanks to equity and market education, we now see foreclosure activity as isolated—not systemic.
And with localized support from local mortgage lenders in West Palm Beach, there’s a human, responsive network helping people take the right next step—not the scariest one.
Section 9: Compare Data, Not Drama
In this age of viral misinformation, the ability to compare data objectively is invaluable.
When you see a spike in foreclosure starts, ask: What does that look like historically? What’s the actual percentage? Is it universal or regional? Temporary or indicative?
The U.S. Foreclosure Map is your compass. It separates speculation from substantiation. It reveals that while some pockets see higher foreclosure rates, the national story is far from collapse.
Here’s how to approach it:
-
Don’t compare a single month to another. Zoom out.
-
Focus on trends, not noise.
-
Acknowledge market shifts, but don’t inflate them into another housing crash.
-
See how your local area performs — especially if you’re based in a growth region like West Palm Beach.
-
Use tools. Whether it’s a West Palm Beach mortgage calculator, preapproval services, or guidance from a mortgage provider, data beats drama.
The foreclosure headlines are loud—but the facts are louder. And they’re saying: stay informed, not afraid.
Conclusion: The Real Story Beneath the Noise
Beneath the hype, beneath the headlines, beneath the surface—there’s a market that’s recalibrating, not collapsing.
Yes, foreclosure filings have inched upward. But they remain at a 0.13% foreclosure rate, dwarfed by the 1 in every 45 homes during the 2010 foreclosure crisis. Today’s environment is built on sturdier foundations: robust lending standards, higher home equity, and widespread borrower education.
With smart action—whether through mortgage preapproval in West Palm Beach, help from a West Palm Beach mortgage broker, or finding the best mortgage rates in West Palm Beach—buyers and owners alike are equipped to move forward with confidence.
So, whether you’re looking to protect the value of your home, understand the real estate market, or simply stay ahead of the narrative, remember this:
The U.S. Foreclosure Map is not a warning sign of a coming crash. It’s a reflection of a maturing market—one where people, professionals, and policies are working together to keep the American dream alive.
And that’s something worth believing in.
Read from source: “Click Me”
Questions, Comments or For more information you can call
Christian Penner Branch Manager at 561-316-6800 or email us at TheMortgageTeam@ChristianPenner.com
Approval Hotline: 561-316-6800
Helping You Achieve the American Dream of Home Ownership


Or You can click “Call Me” below to call Christian Penner directly using Google Voice